Bitcoin DXY Correlation: Does Bitcoin Move With the Dollar Index?
Key takeaway: Bitcoin DXY correlation is a useful research question, not a permanent rule. Compare the time window, the market regime, rates, liquidity, and crypto-specific evidence before treating a shared...
In this article
Key takeaway: Bitcoin DXY correlation is a useful research question, not a permanent rule. Compare the time window, the market regime, rates, liquidity, and crypto-specific evidence before treating a shared move as meaningful.
Bitcoin DXY correlation is often discussed as if a stronger dollar must always mean a weaker Bitcoin price. That shortcut is too simple. Bitcoin and the dollar can move in opposite directions, in the same direction, or with no stable relationship depending on why markets are moving and which timeframe is being measured.
What correlation does and does not say
Correlation describes how two series moved together over a chosen sample. It does not explain causation, guarantee a future relationship, or tell a reader what to buy or sell. A daily correlation can look different from a weekly or monthly correlation because the market is answering different questions at each horizon.
The first editorial requirement is to define the series. DXY is an index with a particular currency basket and weighting. Bitcoin data differs across spot exchanges, benchmarks, and timezones. If the inputs are not documented, the result may be difficult to reproduce.
For dollar data, the Federal Reserve Bank of St. Louis FRED series for the broad dollar index is a credible reference. It is not the same series as DXY, which is why the article should label the data precisely rather than using the terms interchangeably.
Why the relationship can change
Interest-rate expectations
Changes in expected interest rates can affect both the dollar and risk assets. If markets price tighter U.S. policy, the dollar may strengthen while some risk assets face pressure. But if the policy change is interpreted as a response to stronger growth, another asset can react differently. The cause of the dollar move matters.
Liquidity and funding conditions
Global liquidity, credit conditions, and the availability of leverage can influence crypto markets. A dollar move may be part of a broader funding shift, but it is not necessarily the only driver. A researcher should compare rates, volatility, and stablecoin conditions rather than attributing every Bitcoin candle to DXY.
Crypto-specific demand
Network activity, exchange flows, derivatives positioning, custody behavior, and major protocol events can dominate a short window. Three Crypto Market Signals AMG News Is Watching uses a multi-signal approach for this reason. The same logic applies to correlation work: a dollar index is one input, not the whole explanation.
A practical comparison method
Start with a clearly defined window, such as the previous 30 daily observations. Record the close for Bitcoin and the chosen dollar series, calculate percentage changes rather than comparing raw price levels, and state whether the sample contains a major policy meeting or market shock. Then repeat the exercise on a different window to test whether the relationship is stable.
Do not mix a spot price observed at one timestamp with an index close from another timezone. Use one consistent schedule. If the chart uses seven-day rolling data, say so. A transparent method is more valuable than a visually impressive chart that cannot be checked.
The article should also plot the two series separately before showing any correlation line. A reader needs to see whether the relationship is driven by one extraordinary day, a steady trend, or a period of low volatility. A coefficient without the chart can create false confidence.
Read regimes before reading coefficients
An example framework can divide the sample into four qualitative regimes:
- Dollar strength with falling crypto risk appetite.
- Dollar weakness with improving crypto risk appetite.
- Dollar strength and crypto strength together.
- Dollar weakness and crypto weakness together.
The third and fourth cases are especially important. They show why a simple inverse-correlation story can fail. Bitcoin can respond to its own demand, technical structure, or market-specific news even while the dollar is moving in the expected macro direction.
Market structure also matters. Bitcoin dominance can rise while Bitcoin falls if altcoins fall faster. AMG’s Bitcoin dominance explainer warns against reading one percentage as a guaranteed altcoin-season signal. That is the right standard for DXY analysis as well.
Stablecoins add a useful cross-check
Stablecoin supply, liquidity, and redemption confidence can change the way dollar demand appears inside crypto markets. A stablecoin is not the same as cash in every operational circumstance. Readers can use the USDC vs USDT comparison and stablecoin depeg risk guide to understand why settlement conditions matter.
This does not mean stablecoin data should be used to predict Bitcoin. It means the market context is broader than a single fiat index. When the dollar, rates, and stablecoin liquidity point in different directions, the article should describe the disagreement and reduce confidence in any single narrative.
Common mistakes to avoid
The first mistake is using a correlation coefficient as a trading signal. The second is selecting a timeframe after seeing the result. The third is ignoring the difference between price correlation and return correlation. The fourth is citing a chart without naming its source, timestamp, and treatment of missing data.
Another mistake is confusing a plausible mechanism with evidence that the mechanism was active in a particular week. A stronger dollar may matter, but the article still needs to show what changed, when it changed, and whether Bitcoin responded after or before the move.
Conclusion
Bitcoin DXY correlation is worth tracking because it helps organize macro context. It should be reported as a changing relationship, tested across time windows, and combined with rates, liquidity, and crypto-native signals. The result is a more honest briefing: useful for understanding conditions, but not a promise about what comes next.
Prices are indicative and not financial advice.
Related analysis: For the broader dollar backdrop, read our EUR/USD weekly analysis.
Related reporting
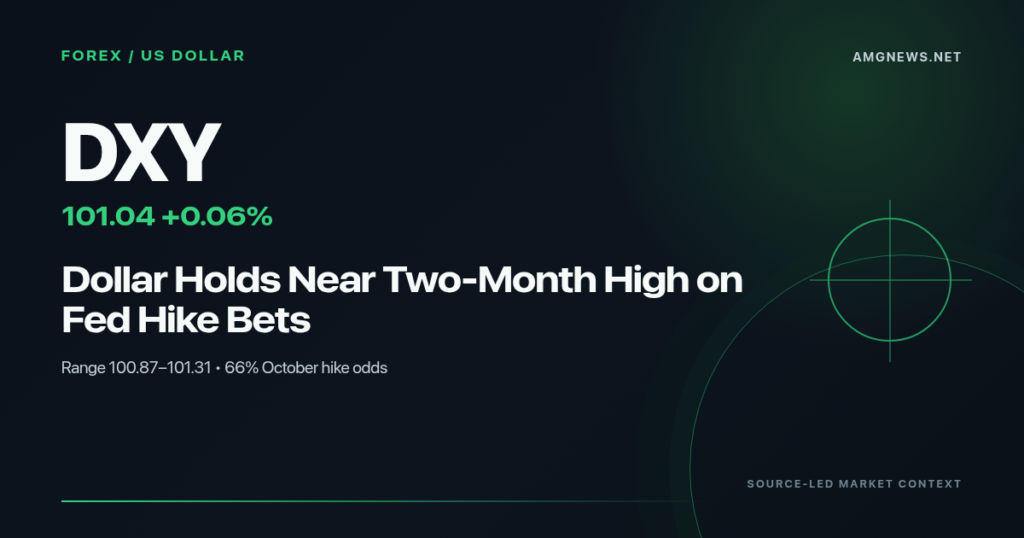
Dollar Holds Near Two-Month High on Fed Hike Bets
Dollar dips but weekly gain remains The newer Reuters report said the dollar declined on September 25 as oil prices eased, but...
USD/JPY Weekly Analysis: Yields, Policy Signals, and Intervention Risk
Key takeaway: USD/JPY weekly analysis should combine the U.S.-Japan yield differential, official policy communication, and market positioning. Intervention risk can change volatility...
EUR/USD Weekly Analysis: Rate Differentials, DXY, and Key Risks
Key takeaway: EUR/USD weekly analysis is strongest when it separates three questions: what markets expect from the Federal Reserve and European Central...
