
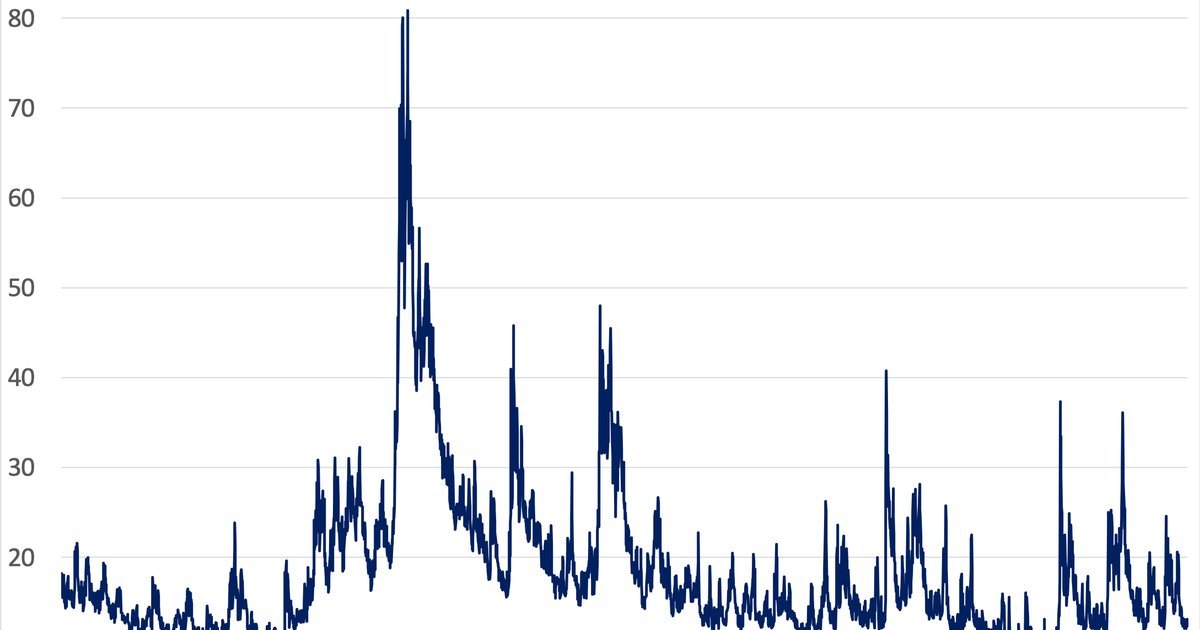

Volatility is one of the most discussed and most misunderstood concepts in financial markets. It is also one of the most important. Volatility drives option prices, affects the cost of hedging, shapes portfolio risk, and influences the behavior of market participants across every asset class. For traders, investors, and risk managers, understanding what volatility actually measures, what drives it, and how to navigate it is fundamental.
This article provides a working framework for understanding volatility, with practical guidance for managing positions during volatile periods.
What Volatility Actually Measures
Volatility, in the most common financial sense, is a measure of how much the price of an asset varies over time. It is usually expressed as the annualized standard deviation of returns. A stock with daily returns that average a 1% move has a different volatility profile than one with daily returns averaging a 3% move, and the difference matters for pricing, risk, and strategy.
Two distinct types of volatility matter. Historical volatility is what has happened; it is calculated from past price data. Implied volatility is what the market expects; it is derived from option prices. The two often diverge, and the gap between them is itself a signal. When implied volatility is higher than historical, the market is pricing in uncertainty; when it is lower, the market is pricing in calm.
What Drives Volatility
Volatility is driven by the flow of information, the positioning of market participants, and the structure of the market itself. Scheduled events, including economic data releases, central bank meetings, and earnings announcements, create predictable spikes in volatility around the event window. Unscheduled events, including geopolitical surprises, large macro shocks, or unexpected company-specific news, drive the larger and more disruptive moves.
Market structure plays a role too. The growth of passive investing, the prevalence of stop-loss and algorithmic orders, and the speed of modern news cycles all influence how price movements translate into realized volatility. In a market with many correlated participants and similar strategies, a move in one area can cascade into other areas more quickly than in a market with more independent participants.
Why Volatility Matters for Different Market Participants
For option buyers, higher implied volatility means higher option premiums, all else equal. For option sellers, higher implied volatility means more premium collected but also more risk if the market moves sharply. For equity investors, higher volatility is generally associated with higher risk and, over long horizons, higher expected returns, though the relationship is not perfectly linear.
For risk managers, volatility is the primary input to most Value at Risk (VaR) models and to many stress-testing scenarios. For corporate treasurers, volatility in currency or commodity prices affects hedging decisions. For central banks and regulators, volatility in financial markets is itself a signal of systemic stress that can affect monetary policy decisions.
Common Volatility Measures
Several volatility indices and measures are widely tracked. The VIX, published by the Chicago Board Options Exchange, measures the 30-day implied volatility of S&P 500 index options and is the most widely cited measure of U.S. equity market volatility. Similar indices exist for other markets, including the V2X for European equities, the VXN for Nasdaq volatility, and the MOVE index for Treasury market volatility.
For currency markets, the JPMorgan Global FX Volatility Index and similar measures track implied and realized volatility across major currency pairs. For commodities, the GVZ (Gold Volatility Index) and CVX (Crude Oil Volatility Index) provide analogous measures. These indices are useful as reference points, but they are not interchangeable across asset classes.
Strategies for Navigating Volatility
Different participants use different strategies. Long-term investors generally benefit from staying invested through volatile periods, since the long-term return profile of diversified equity and credit portfolios is positive, and timing volatile periods is difficult to do consistently. For investors with a multi-decade horizon, volatility-driven price drops can be opportunities to add to positions, not signals to exit.
Active traders have more options. Some use volatility as an asset class in its own right, trading volatility derivatives or running strategies that profit from changes in the volatility regime. Others adjust position sizes based on current volatility, scaling down during high-vol periods and scaling up during low-vol periods. Trend-following strategies often perform well during periods of rising volatility, while mean-reversion strategies often perform better in stable conditions.
The Behavioral Side of Volatility
Volatility is also a behavioral phenomenon. Humans are loss-averse, and large price moves create emotional responses that can lead to poor decision-making. The most common mistake is selling after a sharp decline and buying after a sharp rally, the opposite of what long-term evidence suggests is the optimal behavior. Understanding this bias is one of the most useful things an investor can do.
Pre-commitment strategies, including written investment plans, automatic rebalancing, and dollar-cost averaging, are useful precisely because they reduce the influence of emotional decisions during volatile periods. A well-thought-out plan made in calm conditions is much easier to execute than an improvised decision made during a market crisis.
Tail Risk and Black Swans
Volatility measures based on standard distributions systematically underestimate the frequency and magnitude of extreme events. Real markets exhibit “fat tails,” meaning that once-in-a-decade events happen more often than normal distributions would suggest. Nassim Taleb’s work on Black Swan events popularized this point, and it is now widely accepted in risk management.
The practical implication is that strategies which assume normal distributions will understate true risk. Stress-testing against historical extreme events, including 1987, 2008, and 2020, is more useful than relying on parametric VaR models alone. Hedging tail risk, through deep out-of-the-money options, dynamic strategies, or diversification into assets with low correlation, is a meaningful but expensive form of insurance.
Frequently Asked Questions
What is the VIX?
The VIX is the Cboe Volatility Index, which measures the 30-day implied volatility of S&P 500 index options. It is widely used as a measure of expected U.S. equity market volatility over the coming month.
What is the difference between implied and historical volatility?
Historical volatility is calculated from past price data. Implied volatility is derived from current option prices and represents the market’s expectation of future volatility. They often diverge, and the gap is itself a useful signal.
How do I navigate market volatility as a long-term investor?
For most long-term investors, the best approach is to stay invested, maintain a diversified portfolio, and avoid making large changes during volatile periods. Pre-committed rebalancing and dollar-cost averaging can help reduce the impact of emotional decisions.
What is tail risk?
Tail risk is the risk of an extreme move, larger than what normal statistical models would predict. Markets exhibit fat tails, meaning that truly large negative events happen more often than a normal distribution would suggest. Hedging tail risk is a legitimate but expensive form of insurance.
Should I buy when volatility is high?
It depends on your situation, time horizon, and risk tolerance. For long-term investors with sufficient diversification and liquidity, high-vol periods have historically been good times to add to positions, since the long-term return profile of diversified portfolios is positive. But there is no guarantee that any particular high-vol period will resolve quickly or favorably.